Campaign Reporting System
Project Overview
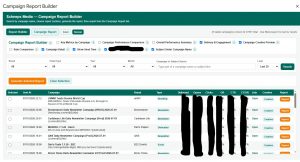
The Campaign Reporting System is an internal reporting application built for Schneps Media’s digital operations and campaign teams. It converts fragmented campaign data into standardized, client-ready performance reports.
Instead of manually gathering metrics from multiple platforms, taking screenshots, calculating performance rates, locating campaign creative, and formatting reports individually, the system centralizes the reporting workflow into one searchable interface.
Users can locate a campaign, review its performance data, compare multiple campaigns, validate results, preview creative, and export a polished report in PDF, document, or spreadsheet format.
The system supports campaign data from platforms including Sailthru, Mailchimp, and AdWallet while standardizing how campaign performance is calculated and presented.
Goal
Build a centralized reporting system that allows operators to generate accurate, consistent campaign reports without manually collecting, calculating, and formatting data from multiple sources.
The goal was to reduce reporting delays, improve data accuracy, standardize client-facing deliverables, and make campaign performance easier for internal teams and clients to understand.
Problem
The campaign reporting workflow depended on several disconnected systems and manual processes.
Campaign metrics, delivery information, creative assets, and client details were stored across different platforms. Operators had to locate the campaign, copy performance metrics, calculate rates, find screenshots or creative files, verify the information, and manually assemble the final report.
That process created four major problems:
-
Campaign reporting took too long
-
Metrics could be calculated or copied inconsistently
-
Reports differed depending on who created them
-
Comparing multiple campaigns required additional manual work
The workflow needed a centralized reporting layer that could use the company’s existing campaign platforms without forcing teams to replace their operational systems.
System Architecture
| Layer | Component | Role |
|---|---|---|
| Data Sources | Sailthru, Mailchimp, AdWallet, and campaign records | Stores campaign metrics, delivery information, metadata, and creative assets |
| Campaign Index | Google Sheets campaign index | Creates a searchable campaign dataset containing IDs, dates, subjects, brands, geography, campaign types, and performance metrics |
| Processing Layer | Google Apps Script | Retrieves, cleans, validates, normalizes, and prepares campaign information |
| Matching Layer | Campaign and creative matching logic | Connects campaign records with the correct delivery proof, creative, publication, and metadata |
| Calculation Layer | Reporting and rate-calculation logic | Calculates open rate, click-through rate, click-to-open rate, delivery rate, and weighted totals |
| Validation Layer | Rules-based checks and AI-assisted analysis | Identifies missing data, inconsistent values, unsupported calculations, and performance insights |
| Interface Layer | Custom HTML, CSS, and JavaScript UI | Gives operators a searchable reporting and campaign-selection interface |
| Comparison Layer | Multi-campaign reporting engine | Compares selected campaigns and calculates combined or weighted performance |
| Rendering Layer | Report templates and chart generation | Converts campaign data into structured visual reports |
| Export Layer | PDF, document, and spreadsheet exports | Produces downloadable and shareable campaign reports |
Future Roadmap
The system is being prepared for migration from its Google Apps Script and Google Sheets foundation into a more scalable web application architecture.
The planned architecture includes:
-
React-based reporting interface
-
Node.js and Express backend
-
Centralized API integrations
-
Dedicated data normalization layer
-
Automated benchmark calculations
-
Rules-based and Gemini-assisted performance analysis
-
Puppeteer-generated PDF reports
-
Scheduled internal reporting
-
Centralized hosting and source control
The migration was intentionally separated from the initial production build. The first priority was proving that the reporting workflow could be standardized and that operators could generate reports faster and more accurately.
Business Impact
The system reduced the amount of manual work required to produce campaign reports while improving consistency across client-facing and internal reporting.
| Metric | Value | Status |
|---|---|---|
| Reporting delay reduction | Approximately 70% | Confirmed internally |
| Operational data accuracy improvement | Approximately 50% | Confirmed internally |
| Campaign platforms supported | Sailthru, Mailchimp, and AdWallet | Confirmed |
| Campaign search | Campaign name, subject, brand, geography, type, and date | Confirmed |
| Multi-campaign reporting | Supported | Confirmed |
| Weighted campaign summaries | Supported | Confirmed |
| Creative preview | Supported | Confirmed |
| Report formats | PDF, document, and spreadsheet | Confirmed |
| Average report preparation time before system | Pending validation | Pending |
| Average report preparation time after system | Pending validation | Pending |
| Campaigns processed | Pending final count | Pending |
| Publications and brands supported | Pending final count | Pending |
| Web application migration | In progress | Confirmed |
Key Features
1. Searchable campaign index
The system builds a centralized index containing campaign IDs, names, subjects, send dates, brands, campaign types, geography, delivery totals, opens, clicks, bounces, unsubscribes, and calculated performance rates.
Operators can find campaigns without manually searching through multiple platforms or spreadsheets.
2. Campaign and subject search
Users can search by campaign name or email subject line, making campaigns easier to locate even when the exact campaign ID is unknown.
3. Brand and campaign filtering
Campaign results can be filtered by brand, geography, campaign type, date, month, and year.
This allows operators to narrow large campaign datasets into the exact records needed for a report.
4. Multi-campaign comparison
Users can select multiple campaigns and generate a combined report containing campaign-level metrics, comparison charts, and weighted overall performance.
This is especially useful for campaign packages, recurring advertisers, and multi-send programs.
5. Automated rate calculations
The system automatically calculates and validates important performance metrics, including:
-
Delivery rate
-
Open rate
-
Click-through rate
-
Click-to-open rate
-
Weighted campaign totals
-
Bounce and unsubscribe performance
This reduces manual calculations and prevents different operators from using inconsistent formulas.
6. Creative and delivery-proof matching
Campaign data can be matched with the appropriate creative assets and delivery proof.
AdWallet metadata is cached and matched locally before the system downloads the selected campaign creative, reducing unnecessary processing and improving reliability.
7. Creative preview
Operators can preview campaign creative directly inside the reporting workflow before producing the final report.
This helps confirm that the selected campaign data and visual assets belong together.
8. Standardized report sections
Reports can include:
-
Campaign-level key metrics
-
Multi-campaign comparisons
-
Weighted performance summaries
-
Delivery and engagement results
-
Creative previews
-
Rate comparisons
-
Campaign detail tables
-
Subject lines
-
Send dates and times
-
Performance charts
Report sections can also change based on campaign type. For example, unsupported CTR information can be suppressed for dedicated campaign formats when appropriate.
9. AI-assisted performance analysis
Rules-based calculations establish the verified campaign results before AI is used.
Gemini can then generate structured performance insights and forward-looking recommendations based on the validated campaign data. Operators retain the ability to review and edit the language before it reaches a client.
10. Multiple export formats
Reports can be exported as PDFs, editable documents, or spreadsheets, depending on how the report will be reviewed, shared, or archived.
Key Product Decisions
Kept existing platforms as the source of truth
Replacing Sailthru, Mailchimp, AdWallet, or the company’s operational spreadsheets would have created unnecessary adoption and migration risk.
The stronger product decision was to build a reporting layer that connects the existing systems and standardizes their output.
Built a centralized campaign index
Repeatedly retrieving and searching raw platform data would have made the reporting interface slower and less reliable.
Creating a normalized campaign index made searching, filtering, comparison, and report generation faster.
Used rules before AI
AI was not allowed to determine the core campaign metrics.
Rates, totals, benchmark differences, and validation checks are calculated through deterministic logic first. AI is used only after the underlying data has been verified.
Kept a human review step
Client-facing analysis should not be sent directly from an AI model without review.
Operators can inspect the data, creative, charts, and generated analysis before exporting or sharing the report.
Supported multi-campaign reporting
The workflow was not limited to single campaign reports because advertisers frequently run multiple sends.
The system supports campaign comparison and weighted summaries instead of forcing operators to combine results manually.
Standardized the final output
Report layouts, calculations, terminology, and chart structures are generated consistently regardless of which operator creates the report.
Separated operational data from presentation logic
The campaign index stores normalized data, while the report-generation layer controls how that information is presented.
This makes it easier to change report designs without rebuilding the campaign ingestion workflow.
Built the production workflow before migrating the technology
The first version focused on proving the reporting process inside Google Apps Script and Google Sheets.
The more scalable React and Node.js architecture was planned after the business workflow and product requirements had already been validated.
Challenges Solved
1. Fragmented campaign data
| Issue | Fix | Result |
|---|---|---|
| Campaign information was stored across multiple platforms and records. | Built a centralized campaign index and data-normalization workflow. | Operators can search and report on campaign data from one interface. |
2. Manual performance calculations
| Issue | Fix | Result |
|---|---|---|
| Operators had to calculate campaign rates and combined results manually. | Added standardized formulas and weighted campaign calculations. | Reports use consistent calculations regardless of who generates them. |
3. Inconsistent report formatting
| Issue | Fix | Result |
|---|---|---|
| Report layout and terminology varied between operators. | Created standardized report templates and sections. | Client-facing reports are more consistent and easier to review. |
4. Campaign and creative matching
| Issue | Fix | Result |
|---|---|---|
| Operators had to manually locate the correct campaign creative and delivery proof. | Added campaign metadata and creative-matching logic. | The correct creative can be previewed and included directly in the report. |
5. Multi-campaign reporting
| Issue | Fix | Result |
|---|---|---|
| Comparing several campaigns required manual spreadsheets and calculations. | Built campaign selection, comparison charts, and weighted summary logic. | Multi-send campaign performance can be presented in one report. |
6. AI reliability
| Issue | Fix | Result |
|---|---|---|
| Allowing AI to interpret unverified campaign data could produce inaccurate conclusions. | Added deterministic calculations, validation rules, structured prompts, and human review. | AI assists with interpretation without controlling the underlying results. |
7. Large campaign datasets
| Issue | Fix | Result |
|---|---|---|
| Locating campaigns became slower as the number of campaign records increased. | Added campaign indexing, caching, search, and multiple filters. | Operators can narrow large datasets quickly. |
8. Report distribution
| Issue | Fix | Result |
|---|---|---|
| Reports had to be manually reformatted depending on how they would be shared. | Added PDF, document, and spreadsheet exports. | Reports can be delivered in the format required by clients or internal stakeholders. |
What I’d Do Differently
If I were starting over, I would separate the data ingestion, normalization, business logic, and report-rendering layers earlier.
Google Apps Script was effective for validating the workflow and delivering production value quickly, but the system became more complex as additional campaign sources, report types, charts, filters, and export requirements were added.
A dedicated backend and normalized database would make scheduled data collection, benchmark calculations, authentication, audit history, and large-scale report generation easier to manage.
I would also define one shared campaign data schema before integrating each platform. That would reduce platform-specific defensive logic and make future integrations easier to add.
Tools Used
| Tool | Purpose |
|---|---|
| Google Apps Script | Core application logic, data processing, interface control, calculations, and report generation |
| Google Sheets | Campaign index, normalized campaign records, configuration, and operational data storage |
| HTML, CSS, and JavaScript | Custom reporting interface |
| SpreadsheetApp | Reading, writing, filtering, and managing campaign data |
| Sailthru data and API | Campaign metadata and performance metrics |
| Mailchimp data and API | Campaign metadata and performance metrics |
| AdWallet | Campaign metadata, delivery information, and creative matching |
| Gemini API | Structured performance insights and forward-looking analysis |
| Google Drive services | Report storage and document generation |
| PDF generation logic | Producing client-ready reports |
| Custom chart logic | Campaign comparisons and performance visualization |
| Custom validation logic | Checking data completeness, calculations, and report eligibility |
| Caching logic | Reducing repeated metadata retrieval and improving performance |
Case Study Summary
The Campaign Reporting System transforms Schneps Media’s fragmented campaign reporting process into a centralized reporting workflow.
It preserves the company’s existing campaign platforms while adding a searchable campaign index, automated calculations, creative matching, multi-campaign comparisons, standardized report templates, AI-assisted analysis, and multiple export options.
The strongest product decision was not to replace the company’s campaign platforms. The better approach was to build an intelligence and reporting layer that connects those systems and converts their data into consistent, usable reports.
By centralizing campaign information and automating the repetitive parts of reporting, the system reduced reporting delays by approximately 70%, improved operational data accuracy by approximately 50%, and gave operators a faster and more reliable way to produce client-facing campaign reports.
Luxury Listing Alert Engine
Automated luxury real estate listing detection, alerting, and sales pipeline management system for Schneps Media.
Project Overview
The Luxury Listing Alert Engine is a Google Apps Script + Google Sheets system built to scan luxury real estate listing sources, detect high-value properties, send internal alerts, and route qualified leads into a managed sales pipeline.
More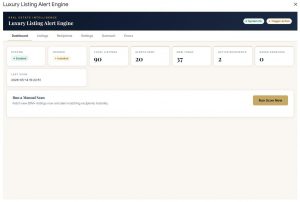

Sales Availability
Digital custom report builder for ad sales availability — turns the Digital Available Dates (D.A.D.) workflow into a self-serve, filterable reporting tool for Schneps Media.
Project Overview
Sales Availability is a custom digital ad availability reporting system built around Schneps Media’s Digital Available Dates workflow, internally known as D.A.D.
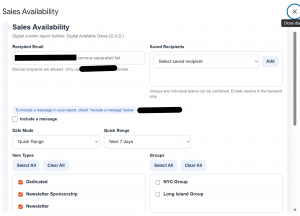
The system gives the digital ad sales team a faster way to generate availability reports by date range, item type, sales group, and recipient list. Instead of manually checking availability and building emails one at a time, users can open a custom report builder, apply filters, include an optional message, and send a clean availability report directly to approved recipients.
The project includes two connected interfaces:
-
Sales Availability dialog — full custom report builder.
-
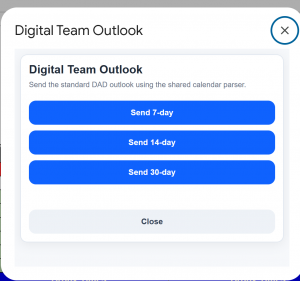
Digital Team Outlook modal — quick-send version for standard 7-day, 14-day, and 30-day outlook reports.
Both interfaces use shared backend availability parsing so the team works from one consistent source of truth.
Goal
The goal was to turn the D.A.D. workflow into a self-serve reporting tool for the digital sales team.
The system needed to:
-
Let sales users generate availability reports without manually searching through dates.
-
Support quick outlook sends for standard reporting windows.
-
Filter availability by date range, item type, and sales territory.
-
Manage recipients safely using saved groups and approved manual entries.
-
Keep group email resolution handled in the backend.
-
Reduce repetitive digital-team reporting work.
Problem
The D.A.D. workflow contained valuable availability data, but the reporting process was too manual.
Sales and digital team members needed a faster way to answer practical availability questions:
-
What inventory is open in the next 7 days?
-
What is available for the next 14 or 30 days?
-
Which item types are open?
-
Which sales groups should receive the report?
-
Can this be sent without manually exposing or managing every backend address?
The old workflow depended too much on manual checking, manual email preparation, and repeated internal coordination.
The workflow needed a cleaner reporting interface, safer recipient handling, and faster access to filtered availability.
System Architecture
| Layer | Component | Purpose |
|---|---|---|
| Data Source | Digital Available Dates workflow | Source of digital ad availability data |
| Backend Logic | Shared calendar parser | Reads and resolves availability across selected ranges |
| Report Builder UI | Sales Availability dialog | Full custom reporting interface |
| Quick Send UI | Digital Team Outlook modal | Sends standard 7/14/30-day outlook reports |
| Date Logic | Quick Range + Custom Date Mode | Lets users select preset or custom reporting windows |
| Inventory Filters | Item Types | Filters availability by Dedicated, Newsletter, Newsletter Sponsorship, Website Takeover, and Sponsored Content |
| Territory Filters | Groups | Filters by NYC Group and Long Island Group |
| Recipient Layer | Manual entry + Saved Recipients | Supports individual recipients, teams, and combinable groups |
| Safety Rules | Approved-sender logic | Restricts manual entries to Schneps-approved addresses |
| Email Output | Resolved backend recipients | Sends reports using backend recipient resolution |
Key Features
1. Full Custom Report Builder
The Sales Availability dialog allows users to generate targeted reports by selecting date range, item types, sales groups, recipients, and optional message text.
2. Quick-Send Outlook Reports
The Digital Team Outlook modal gives the team fast buttons for common reporting windows:
-
Send 7-day outlook
-
Send 14-day outlook
-
Send 30-day outlook
These quick sends use the same shared parser as the full report builder.
3. Flexible Date Filtering
The system supports both quick presets and custom ranges through Date Mode:
-
Quick Range
-
Custom Date Range
-
Next 7 days
-
Next 14 days
-
Next 30 days
4. Inventory Type Filtering
Users can filter reports by ad inventory category, including:
-
Dedicated
-
Newsletter
-
Newsletter Sponsorship
-
Website Takeover
-
Sponsored Content
5. Sales Territory Filtering
The report builder supports group-level filtering by sales territory:
-
NYC Group
-
Long Island Group
6. Recipient Management
Users can manually enter recipients or select from saved recipient groups. Groups and individuals can be combined, giving the team flexibility without rebuilding recipient lists every time.
7. Approved-Sender Protection
Manual recipient entry is restricted to Schneps-approved addresses, preventing accidental sends to unauthorized contacts.
Key Product Decisions
-
Built two interfaces instead of one overloaded screen.
The full Sales Availability dialog supports detailed custom reports, while the Digital Team Outlook modal handles the most common 7/14/30-day reporting workflow. That kept the system flexible without slowing down routine sends. -
Used one shared backend parser for both workflows.
The custom report builder and quick-send modal both rely on the same calendar parsing logic. This avoided duplicate logic and kept report output consistent. -
Kept quick ranges simple.
The 7-day, 14-day, and 30-day presets match how the digital team actually sends outlook reports. The tool was designed around real workflow behavior, not unnecessary configuration. -
Separated recipient selection from backend email resolution.
Users can select saved groups, individual teams, or manual addresses, but the backend resolves group emails before sending. This protects internal distribution details and keeps the sending experience clean. -
Restricted manual recipient entry.
Approved-sender logic prevents reports from being sent to unapproved addresses. That decision made the system safer for internal sales operations. -
Added optional message support without making it required.
Some reports need context, but many do not. Keeping the message optional made the tool faster while still allowing human explanation when needed.
Challenges Solved
1. Manual Availability Reporting
| Issue | Fix | Result |
|---|---|---|
| Users had to manually check availability and prepare reports. | Built a self-serve report builder connected to the D.A.D. workflow. | Availability reports can now be generated on demand. |
2. Repetitive 7/14/30-Day Outlook Sends
| Issue | Fix | Result |
|---|---|---|
| Standard outlook reports were repetitive and time-consuming. | Added quick-send buttons for 7-day, 14-day, and 30-day outlooks. | The digital team can send standard outlooks faster with fewer clicks. |
3. Inconsistent Report Filtering
| Issue | Fix | Result |
|---|---|---|
| Users needed to filter by date, item type, and group without rebuilding reports manually. | Added Date Mode, Quick Range presets, item type filters, and group filters. | Reports became more targeted and easier to customize. |
4. Recipient List Management
| Issue | Fix | Result |
|---|---|---|
| Manually entering the same recipients repeatedly created friction and risk. | Added saved recipients with dropdown selection and combinable groups. | Users can send to the right people faster while reducing entry mistakes. |
5. Unauthorized Recipient Risk
| Issue | Fix | Result |
|---|---|---|
| Manual recipient entry could accidentally include unapproved addresses. | Added Schneps-approved sender logic. | Report sending became safer and more controlled. |
6. Duplicate Logic Risk
| Issue | Fix | Result |
|---|---|---|
| Separate custom and quick-send workflows could have created inconsistent report results. | Used one shared backend parser for both interfaces. | Both report flows produce consistent availability output from the same logic. |
What I’d Do Differently
If I were starting over, I would define the shared calendar parser as the core product layer earlier, before building separate interface flows. The tool works because both the full Sales Availability dialog and the quick-send Digital Team Outlook modal rely on the same backend logic. Locking that shared parser down first would have made the UI decisions cleaner and reduced the risk of duplicated logic as more report options were added.
Business Impact
In production, the system generates digital availability reports on demand and powers the standard 7/14/30-day outlook sends used by the digital team.
| Metric | Value | Status |
|---|---|---|
| Reporting interfaces built | 2 — Sales Availability + Digital Team Outlook | Complete |
| Quick-send outlook options | 3 — 7-day, 14-day, 30-day | Complete |
| Item types tracked | 5 — Dedicated, Newsletter, Newsletter Sponsorship, Website Takeover, Sponsored Content | Complete |
| Sales groups supported | 2 — NYC Group, Long Island Group | Complete |
| Publications supported by whitelist | 15 | Complete |
| Approved manual-entry rule | Schneps-approved email addresses only | Complete |
| Reports generated on demand | Pending | |
| Recipients reached | Pending | |
| Scheduled outlooks sent per week | Pending | |
| Manual report-building time saved | Pending | |
| Saved recipient groups configured | Pending |
Tools Used
-
Google Apps Script
-
Google Sheets
-
Custom HTML/CSS dialogs
-
JavaScript
-
Gmail / email sending logic
-
Shared calendar parsing logic
-
Recipient validation logic
Case Study Summary
Sales Availability turned the Digital Available Dates workflow into a practical self-serve reporting tool for Schneps Media’s digital ad sales team.
The system gives users two paths: a full custom report builder for detailed availability reports and a quick-send outlook modal for standard 7/14/30-day sends. With date filtering, item type filtering, territory filtering, saved recipients, approved-sender protection, and backend group email resolution, the project reduced manual reporting friction while keeping the workflow controlled and consistent.
The strongest product decision was separating the user-facing reporting experience from the backend availability parser. That made the system easier to expand, safer to operate, and more useful for the digital team’s real day-to-day workflow.
Operations Agent
AI-powered inbox extraction and calendar-booking system for Schneps Media.
Project Overview
The Operations Agent is an internal AI-powered workflow system built to help Schneps Media process booking and scheduling requests from a shared Gmail inbox.
Internally referred to as the Schneps AI Inbox Calendar Agent, focused on reading labeled inbox threads, extracting booking details, validating calendar availability, and preparing approved calendar writes.
The system was designed to reduce manual inbox review, prevent messy booking requests from slipping through, and create a safer path from email intake to calendar scheduling.
The core challenge was not simply “read an email with AI.” The real product problem was building a controlled operations workflow where AI could assist with extraction, but every risky action remained protected by validation, confidence thresholds, dry-run testing, rollback logic, and human review when needed.
Problem
Scheduling requests were arriving through email threads that required manual review before they could be turned into calendar actions.
The manual process created several operational problems:
-
Email threads had to be opened and interpreted one by one.
-
Booking details were often buried inside natural-language messages.
-
Requests could include multiple publications, dates, or slots.
-
Ambiguous requests needed human review instead of automatic action.
-
Calendar writes needed protection against partial or incorrect updates.
-
The system needed to support future AI providers without being hard-locked to one model.
The goal was to build a controlled internal agent that could process labeled Gmail threads, extract structured booking information, validate the request, and prepare safe calendar actions without allowing AI to directly control live scheduling.
Product Goal
Build a secure internal operations agent that can:
-
Read approved Gmail threads from a shared inbox.
-
Extract booking details using AI.
-
Validate the extracted data against calendar rules.
-
Route unclear requests to a review path.
-
Protect all calendar-writing actions with dry-run checks and rollback logic.
-
Support Gemini now while preserving future support for OpenAI and Claude.
-
Keep sensitive API keys out of Google Sheets.
-
Give the team a UI for configuration, testing, and controlled operation.
Core Features
-
Gmail thread reading from the shared inbox
-
AI extraction with minimum confidence threshold
-
Natural-language rule teaching
-
Mock mode and Gemini API connection testing
-
Domain-wide delegation with secure API key handling
System Architecture
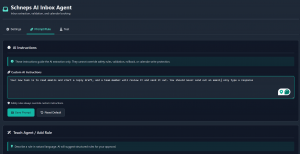
| Layer | Function |
|---|---|
| Gmail API | Reads labeled Gmail threads from the shared inbox |
| Domain-Wide Delegation | Allows controlled service-account access to approved mailbox scope |
| AI Provider Layer | Sends thread content to Gemini or Mock provider for extraction |
| Validation Layer | Checks confidence, required fields, date logic, and calendar-readiness |
| Calendar Locator | Finds the correct calendar sheet, month tab, row, and target cell |
| Calendar Writer | Prepares protected calendar writes with rollback protection |
| Settings UI | Allows configuration of sheets, provider, confidence threshold, and overseers |
| Script Properties | Stores API keys securely outside the spreadsheet |
| Review/Attention Flow | Routes unclear or failed requests for human review |
Key Product Decisions
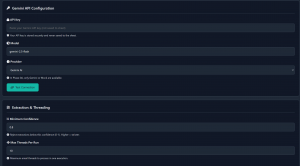
1. AI does not get direct calendar control
The system uses AI for extraction, not unchecked execution. AI output must pass validation before any write logic can proceed.
This keeps the agent useful without giving the model authority over live operational data.
2. Mock mode comes before live AI dependency
Mock mode allows the extraction and workflow path to be tested even before Gemini is fully connected.
That was important because the system needed a testable architecture first, not a fragile demo dependent on one API call.
3. Confidence threshold controls automation risk
The system includes a minimum confidence setting so weak AI extractions can be rejected instead of trusted.
This matters because scheduling errors are operationally expensive. A low-confidence extraction should create review work, not calendar damage.
4. Provider architecture stays flexible
The early implementation supports Gemini and Mock, but the structure leaves room for OpenAI and Claude later.
This avoids building the product around one provider too early.
5. Secure key handling
API keys are not saved to Google Sheets. Sensitive keys belong in Apps Script properties.
That decision protects the system from exposing credentials inside a shared operational spreadsheet.
6. Domain-wide delegation is treated as a controlled permission layer
The system is built around the reality that shared inbox automation needs proper Workspace-level authorization.
Rather than using browser automation or individual-user shortcuts, the system uses a cleaner service-account path approved through Google Admin.
Safety & Reliability Controls
| Control | Purpose |
|---|---|
| Minimum confidence threshold | Prevents weak extractions from moving forward |
| Mock mode | Allows safe testing without live AI dependency |
| Dry-run write logic | Confirms write path before live calendar updates |
| Live write toggle | Keeps calendar booking disabled until proven safe |
| Rollback service | Protects against partial write failure |
| Lock handling | Prevents conflicting simultaneous writes |
| Needs Attention routing | Sends messy or unclear cases to human review |
| Approved sender logic | Prevents unwanted external requests from being processed |
| Script Properties | Keeps API keys outside the spreadsheet |
| Test functions | Provides controlled verification before live operation |
Business Impact
In testing, the system processed labeled Gmail threads end-to-end through extraction, validation, and protected dry-run write logic before live calendar writes were enabled.
| Testing Metric | Current Result |
|---|---|
| Controlled Gmail test threads processed | 1 confirmed test thread |
| Messages read from test thread | 1 message found |
| Gmail access token | Successfully obtained |
| Gmail thread read | Successful |
| Dry-run executable status | true |
| Live modify executable status | false by design |
| Extraction success rate | Not claimed yet; no reliable percentage recorded |
| Dry-run failure count | Not separately recorded in available testing notes |
The value of this testing phase is that the system proved the controlled workflow path before allowing live calendar modification. That is the correct product move. For an operations tool, proving safe execution matters more than showing a flashy AI demo.
Current Status
The Operations Agent is in a controlled testing phase.
The system has working configuration screens, provider selection, Gemini API setup, mock testing support, Gmail-read preparation, confidence-threshold settings, sheet configuration, and protected calendar-write planning.
The live calendar write path remains intentionally restricted until extraction quality, validation behavior, and rollback safety are fully proven.
Current implementation priorities:
-
Prove Gmail thread reading through domain-wide delegation.
-
Confirm extraction quality across real scheduling examples.
-
Validate confidence thresholds.
-
Confirm dry-run behavior.
-
Keep live write disabled until the system is safe.
-
Route unclear or risky requests to human review.
What I’d Do Differently
If I were starting over, I would define the confidence-threshold testing framework earlier. The extraction worked, but tuning confidence rules after the fact made it clear that AI output needs measurable review gates before automation touches live calendar data.
Case Study Summary
The Operations Agent is not just an AI inbox reader. It is a controlled operations workflow built around safety, validation, and phased automation.
The strongest product decision was separating AI extraction from live execution. Instead of trusting the model to “do the work,” the system treats AI as one layer inside a larger workflow that includes rules, thresholds, dry-runs, rollback protection, and human review.
This makes the project stronger as a product case study because it shows practical AI implementation, not AI hype.
The system demonstrates:
-
AI-assisted workflow automation
-
Internal tool design
-
Secure Google Workspace integration
-
Gmail API and domain-wide delegation planning
-
Calendar-write safety controls
-
Provider-agnostic architecture
-
Human-in-the-loop review logic
-
Product judgment around automation risk
The result is a safer internal operations agent designed to reduce manual scheduling work while protecting the business from bad AI output.
Print Availability Reader
Print inventory intelligence tool that turns complex multi-tab availability data into a searchable sales interface for Schneps Media.
Project Overview
The Print Availability Reader is a Google Apps Script and Google Sheets-based internal sales tool built for Schneps Media’s print sales team. It converts complex, multi-tab print availability spreadsheets into a fast, searchable interface where sales users can quickly find open inventory by publication, date range, and ad position.
Instead of manually opening multiple spreadsheet tabs, scanning weeks, checking color codes, and comparing ad positions one by one, the tool reads the live availability data and presents it in a structured, filterable format.
Two independent versions were built: one for Nassau and one for NYC, allowing each market to maintain its own print inventory workflow while using the same core product logic.
Goal
Build a self-serve print inventory reader that helps sales users quickly identify available ad space without manually searching through complex multi-tab spreadsheets.
The goal was to reduce friction, speed up sales response time, and make availability easier to search, report, and share.
Problem
The print availability workflow depended on spreadsheets that were difficult to navigate quickly. Availability data lived across multiple tabs, publications, positions, and weeks. Sales users had to manually search through sheets, interpret color-coded cells, and confirm whether specific ad positions were open.
That process created three major problems:
-
Manual searching was slow
-
Availability was hard to compare across publications
-
Sales follow-up depended on spreadsheet familiarity
The workflow needed a cleaner sales interface layered on top of the existing inventory sheets without forcing the print team to rebuild its entire system.
System Architecture
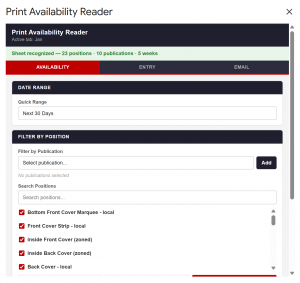
| Layer | Component | Role |
|---|---|---|
| Data Source | Google Sheets print availability files | Stores live print inventory across multiple tabs |
| Processing Layer | Google Apps Script | Reads sheet structure, scans active tabs, and interprets availability data |
| Detection Logic | Tab, publication, position, and week detection | Automatically identifies the usable inventory structure without manual lookup |
| Interface Layer | Custom Apps Script UI | Gives sales users a searchable view of print availability |
| Filtering Logic | Date range, publication, and ad position filters | Narrows complex spreadsheet data into targeted availability results |
| Market Versions | Nassau version and NYC version | Keeps regional print workflows separate while using the same core product approach |
| Reporting Layer | Email reporting | Packages filtered open inventory into shareable sales reports |
Future Roadmap
A future Calendar Year Duplicator extension was scoped but deferred. The feature would support faster year-to-year setup of print availability structures, but it was intentionally kept out of the first production build so the core reader could stay focused on the highest-value workflow: finding open inventory quickly.
Business Impact
In production, the system runs against live print inventory sheets and gives the sales team a fast, filterable view of open inventory.
| Metric | Value | Status |
|---|---|---|
| Markets supported | 2 — Nassau and NYC | Confirmed |
| Publications covered | Pending | |
| Active sheet tabs scanned | Pending | |
| Weeks scanned per tab | Pending | |
| Ad positions tracked | Pending | |
| Average search time before tool | 10–20 minutes | Estimated / Validate |
| Average search time after tool | Under 1 minute | Estimated / Validate |
| Search filters available | Date range, publication, ad position | Confirmed |
| Email reporting supported | Yes | Confirmed |
| Future Calendar Year Duplicator | Scoped, deferred | Confirmed |
Key Features
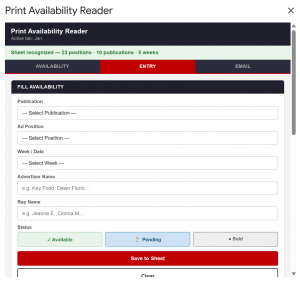
1. Multi-tab inventory scanning
The system scans across multiple active spreadsheet tabs instead of relying on users to manually check each sheet.
2. Automatic detection logic
The reader detects active tabs, publications, ad positions, and weekly availability structures automatically.
3. Searchable sales interface
Sales users can filter by date range, publication, and ad position to find open print inventory in seconds.
4. Chip-style publication filters
Publication selections are displayed as clean filter chips, making multi-publication searching easier to read and manage.
5. Date range picker
The tool allows users to search specific sales windows instead of scanning full sheets manually.
6. Color-coded availability indicators
Availability results preserve visual status cues so users can quickly understand open, unavailable, or restricted inventory.
7. Email reporting
Filtered results can be packaged into an email report, helping sales users quickly share availability with reps or internal teams.
Key Product Decisions
-
Kept the existing spreadsheets as the source of truth
Rebuilding the inventory system from scratch would have created adoption risk. The better product decision was to build a smarter reader on top of the workflow the team already used. -
Built separate Nassau and NYC versions
Instead of forcing both markets into one shared interface too early, the system keeps each market independent. That reduced complexity and avoided breaking local workflows. -
Focused on open inventory discovery first
The core value is helping sales find available space faster. Extra features were secondary to making the search experience clean, fast, and useful. -
Used automatic detection instead of hardcoding every sheet structure
The spreadsheets could change over time, so the reader needed to detect tabs, publications, positions, and weeks dynamically wherever possible. -
Deferred the Calendar Year Duplicator extension
The duplicator was useful, but it was not required for the first production value. Deferring it kept the project focused on the main pain point: reading and searching availability. -
Designed the interface around sales behavior, not spreadsheet structure
Sales users care about what is available, where, and when. The interface was built around those questions instead of exposing the raw spreadsheet complexity.
Challenges Solved
1. Multi-tab spreadsheet complexity
| Issue | Fix | Result |
|---|---|---|
| Availability was spread across multiple tabs, making it hard to search quickly. | Built multi-tab scanning logic that reads active tabs automatically. | Sales users can search across complex inventory structures from one interface. |
2. Manual publication filtering
| Issue | Fix | Result |
|---|---|---|
| Users had to visually scan for the right publication inside spreadsheet layouts. | Added publication detection and chip-style publication filters. | Users can select one or multiple publications cleanly without digging through sheets. |
3. Date range searching
| Issue | Fix | Result |
|---|---|---|
| Finding availability for a specific sales window required manually checking weeks. | Added a date range picker tied to the scanning logic. | Users can narrow results to the exact date window they need. |
4. Position-based inventory lookup
| Issue | Fix | Result |
|---|---|---|
| Sales users needed to know whether specific ad positions were open. | Added ad position filtering and position detection. | Users can search by position instead of manually reading every row or section. |
5. Market-specific workflows
| Issue | Fix | Result |
|---|---|---|
| Nassau and NYC inventory workflows needed separation. | Built two independent versions of the reader. | Each market can operate without interfering with the other. |
6. Reporting filtered availability
| Issue | Fix | Result |
|---|---|---|
| Sharing availability required copying information manually from the sheet. | Added email reporting from filtered results. | Sales users can send cleaner availability summaries faster. |
What I’d Do Differently
If I were starting over, I would define a stricter shared data structure before building the reader logic. The system works because it adapts to complex sheets, but the more flexible the reader becomes, the more defensive logic it needs. A cleaner spreadsheet standard upfront would reduce scanning complexity, improve speed, and make future features like the Calendar Year Duplicator easier to build.
Business Impact
In production, the system runs against live print inventory sheets and gives the sales team a fast, filterable view of open inventory.
| Metric | Value | Status |
|---|---|---|
| Markets supported | 2 — Nassau and NYC | Confirmed |
| Publications covered | Pending | |
| Active sheet tabs scanned | Pending | |
| Weeks scanned per tab | Pending | |
| Ad positions tracked | Pending | |
| Average search time before tool | Pending | |
| Average search time after tool | Pending | |
| Search filters available | Date range, publication, ad position | Confirmed |
| Email reporting supported | Yes | Confirmed |
| Future Calendar Year Duplicator | Scoped, deferred | Confirmed |
Tools Used
| Tool | Purpose |
|---|---|
| Google Apps Script | Core application logic, UI, scanning, and reporting |
| Google Sheets | Live print inventory data source |
| HTML/CSS/JavaScript | Custom user interface inside Apps Script |
| SpreadsheetApp | Reading tab, row, column, and cell data |
| GmailApp / MailApp | Email reporting functionality |
| Custom filtering logic | Date range, publication, position, and availability searches |
Case Study Summary
The Print Availability Reader turns Schneps Media’s complex print availability spreadsheets into a usable sales intelligence tool. It preserves the existing Google Sheets workflow while adding a faster interface for searching open inventory across tabs, publications, dates, and ad positions.
The strongest product decision was not to replace the spreadsheet system. The better move was to build a reader that makes the existing system easier to use.
By creating separate Nassau and NYC versions, adding chip-style publication filters, supporting date range and position searches, and enabling email reporting, the system gives the print sales team a faster way to find and share available inventory without manually digging through spreadsheet tabs.